Dashboard Guide
Manage L402 proxies, monitor revenue, configure pricing — all from the dashboard, no code required for the dashboard surface itself.
The dashboard is your complete control panel for L402 proxy management. No Lightning node to run, no server to deploy, no DevOps expertise needed. Configure everything from your browser.
Accessing the Dashboard
- Navigate to api.lightningenable.com/dashboard
- Enter your email for a magic link (or use your API key directly)
- You're in — no additional accounts or passwords needed
Configuring Your Payment Provider
Before creating proxies, add your payment provider credentials in Settings → Payment Provider:
- Go to the Settings page in the dashboard
- In the Payment Provider section, pick your provider from the Settlement Provider dropdown — Strike (Recommended) or OpenNode
- Paste your API key in the field that appears (labeled Strike API Key or OpenNode API Key depending on the dropdown selection)
- Click Save Key, then Validate to confirm the key is working
Sign up at strike.me and get your API key from dashboard.strike.me. Strike is the recommended provider — it supports preimage return for full L402 compatibility.
If you choose OpenNode and don't have an account yet, sign up at app.dev.opennode.com — no KYB required, test with Bitcoin testnet. When you're ready for production, swap your dev key for a production key in Settings.
Dashboard Overview
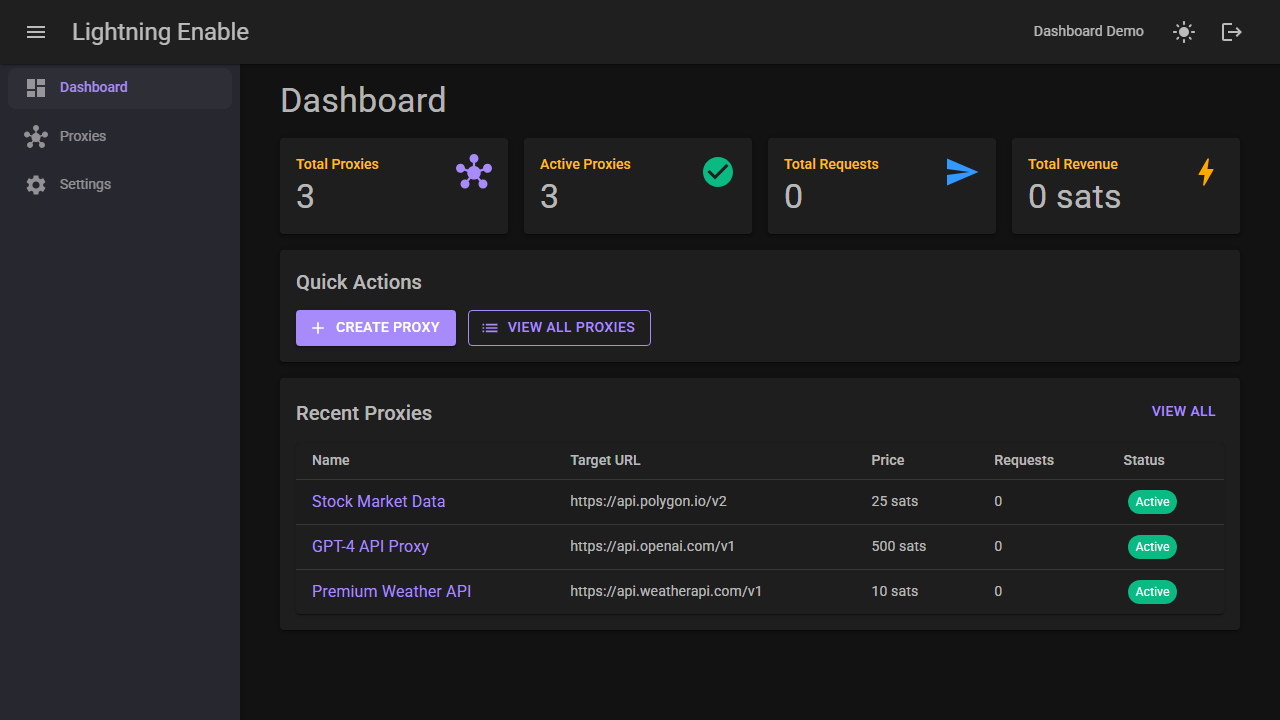
The home screen shows:
- 4 summary cards — Total Proxies, Active Proxies, Total Requests, and Total Revenue (cumulative across all your proxies)
- Quick Actions — Create Proxy and shortcuts to common tasks
- Recent Proxies — Your most recently modified proxies with status indicators
Managing Proxies
Proxy List
Navigate to the Proxies tab to see all your L402 proxies in a searchable, sortable table.
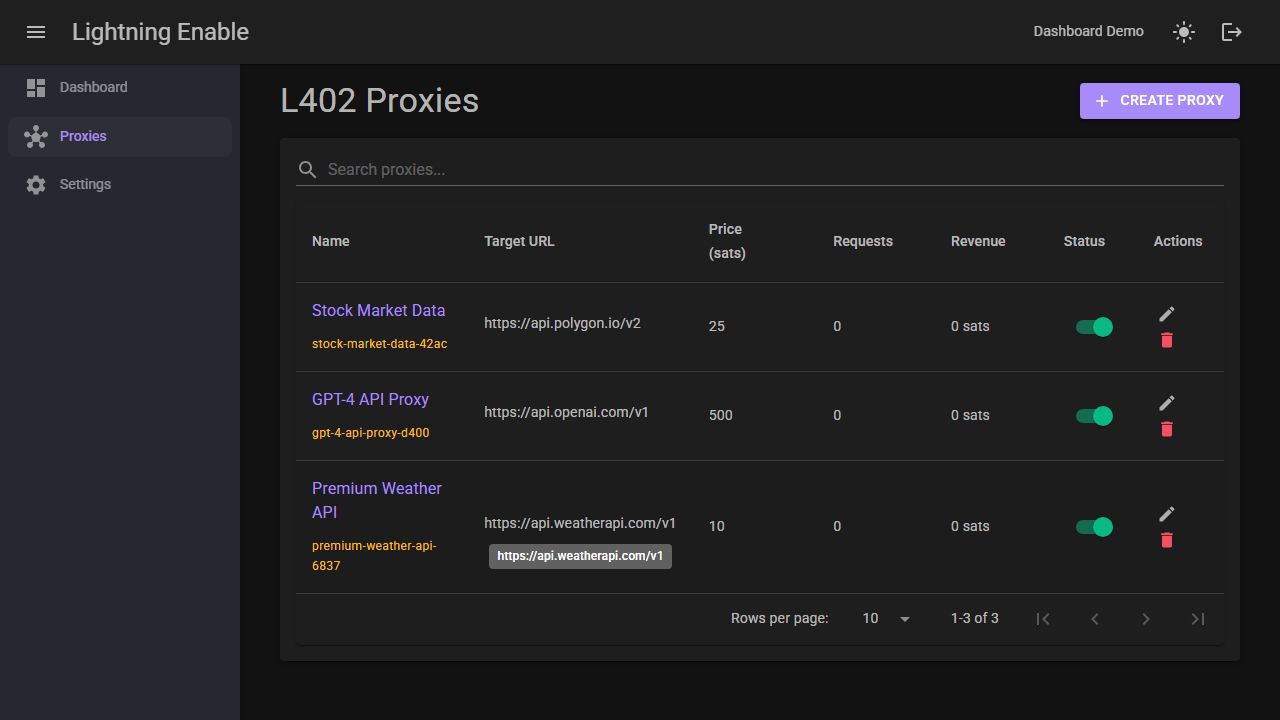
Key features:
- Search matches against proxy name, Proxy ID slug, and Target URL — type any substring of any of the three
- Sort columns by Name, Price (sats), Requests, or Revenue
- Enable/disable proxies with one-click toggle switches
- Status indicators — green (active), gray (disabled)
Creating a Proxy (4-Step Wizard)
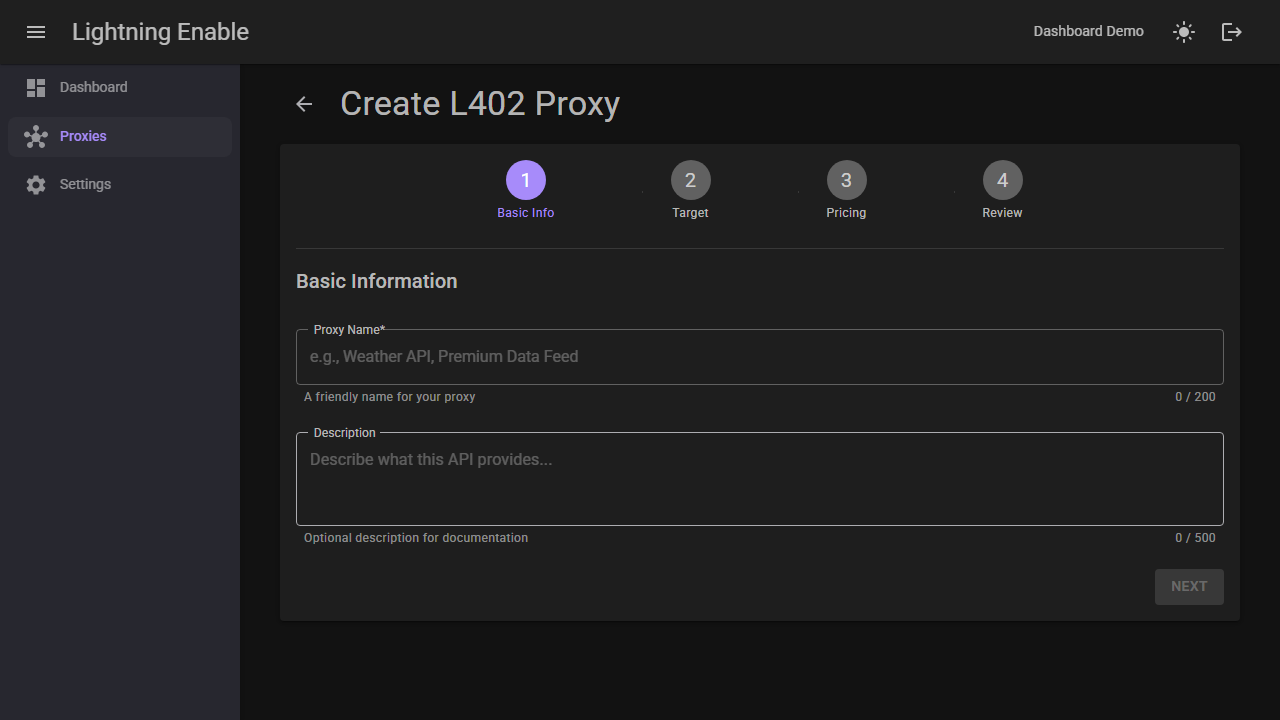
Click Create Proxy to launch the guided wizard.
Step 1: Basic Info Enter a name and optional description for your proxy.
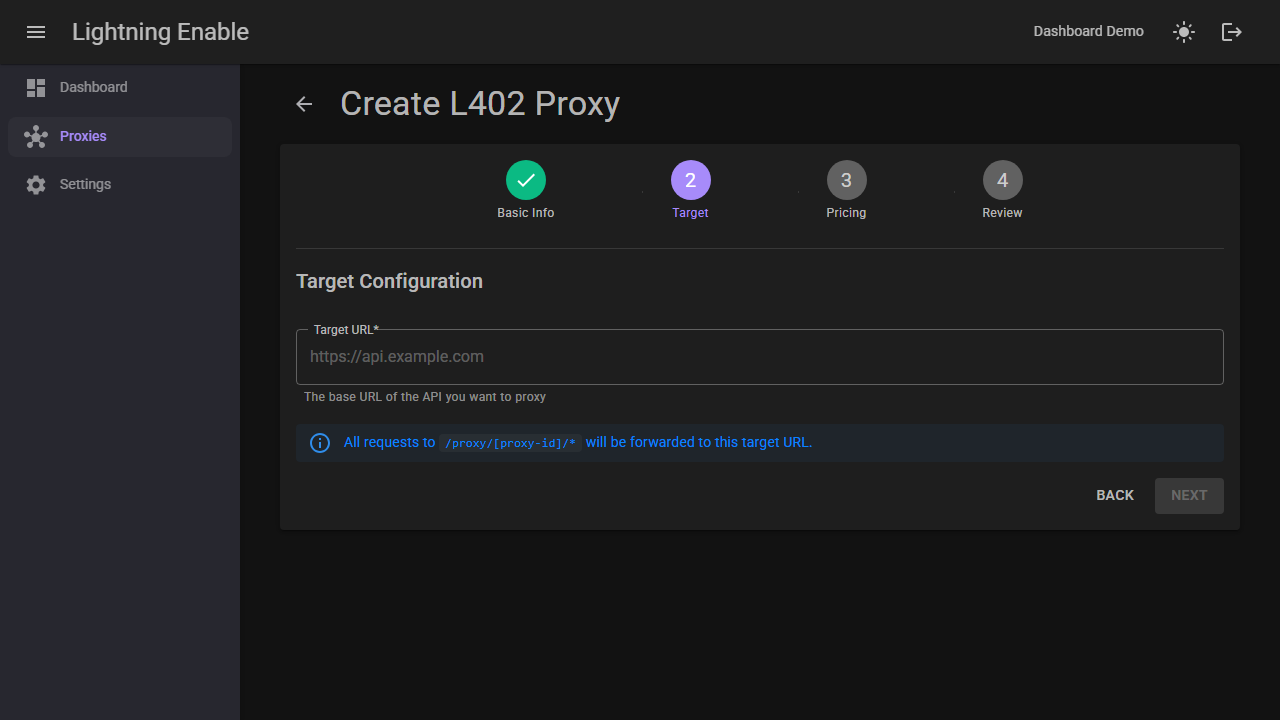
Step 2: Target URL
Configure the target API URL — the base URL of the API you are proxying. All requests to /l402/proxy/{proxy-id}/* are forwarded to this address. Lightning Enable does not store or inject upstream credentials; see the proxy setup walkthrough for how to handle APIs that require auth.
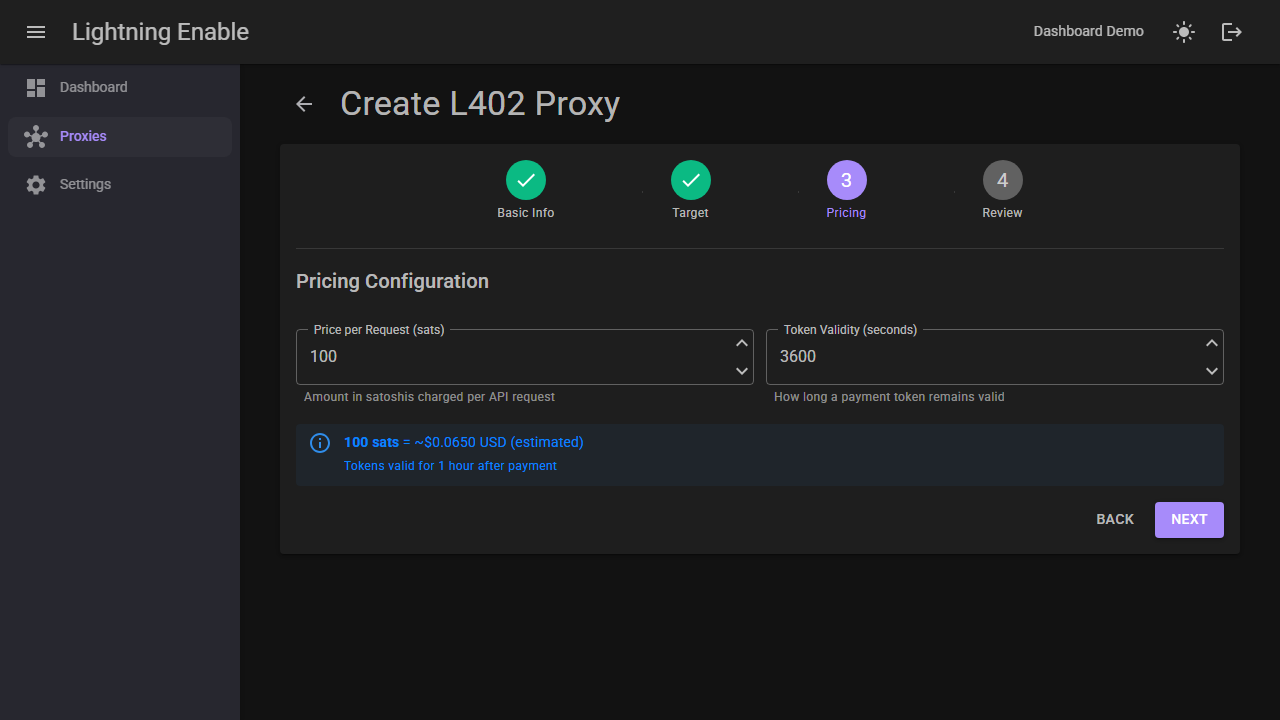
Step 3: Pricing Set the default price in satoshis per request and token validity period. A live USD estimate is displayed based on current BTC price.
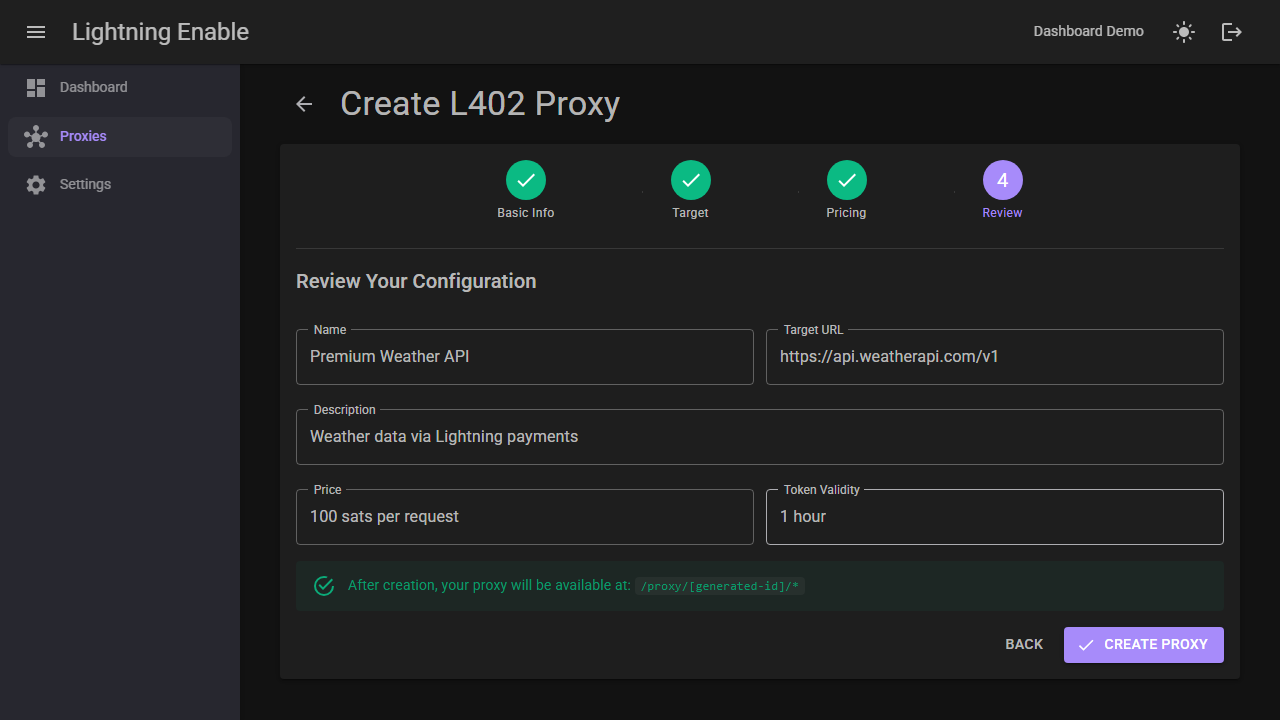
Step 4: Review Review all settings before creating the proxy.
Proxy Detail Page
Click any proxy to view its detail page with multiple tabs.
For a step-by-step guide to the entire setup flow — from creating a proxy to getting discovered by AI agents — see Setting Up Your Proxy.
Overview Tab
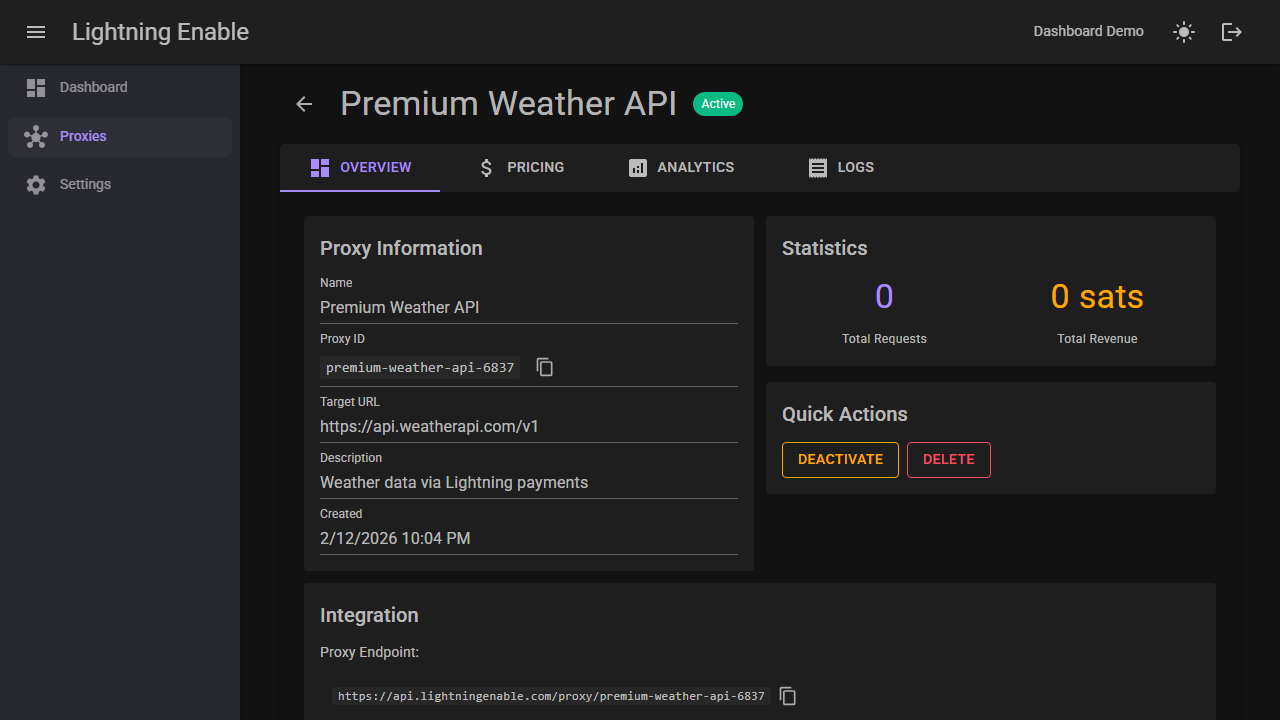
Shows:
- Proxy information (name, target URL, status)
- Quick stats (total requests, revenue, active tokens)
- Integration URL — the full proxy URL to share with clients
- Example curl command — copy-paste ready for testing
Pricing Tab
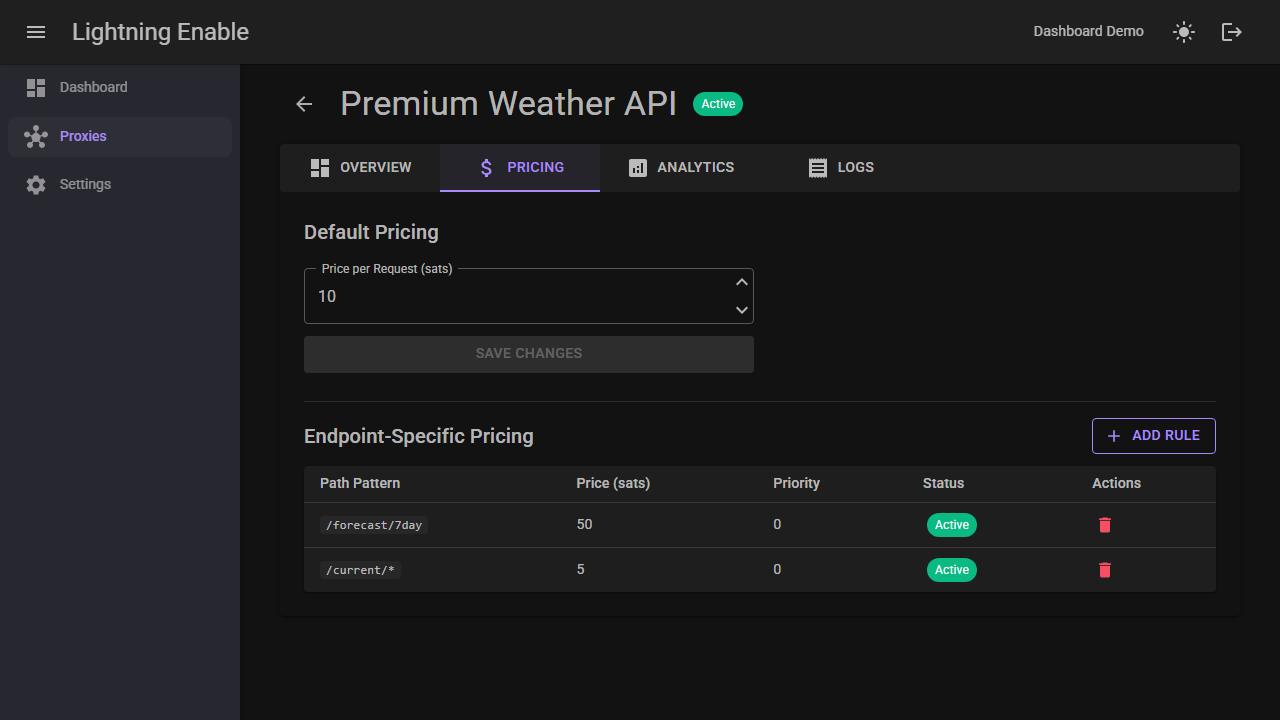
The Pricing tab combines everything needed to make your API discoverable and correctly priced:
- Default Fallback Price — the price charged for any request that does not match a specific endpoint rule. Set this once if all your endpoints cost the same amount.
- Manifest settings — turn on the manifest to publish a public description file that AI agents read. Fill in the Service Description, Contact Email, Documentation URL, and Terms of Service URL to complete your public listing.
- API Endpoints table — the per-endpoint catalog that agents read. Use Scan API to import from your OpenAPI/Swagger spec, or Add Manual for APIs without a spec.
- Preview & Share — URLs for the machine-readable manifest (JSON), a human-readable version (Markdown), and the public registry.
See the full Pricing tab walkthrough for detailed guidance on each section.
Per-day analytics charts and a real-time request log are on the roadmap. Aggregate Total Requests and Total Revenue are visible on the Overview tab today; daily breakdowns and request-level logs will surface as separate tabs once they're backed by real telemetry. Until then, query GET /api/proxy/{proxyId}/analytics for the totals via REST.
Dashboard vs API
Both the dashboard and REST API provide full proxy management. Use whichever fits your workflow:
| Action | Dashboard | REST API |
|---|---|---|
| Create proxy | 4-step visual wizard | POST /api/proxy |
| Update pricing | Inline editing | PUT /api/proxy/{proxyId} |
| Toggle status | One-click switch | PUT /api/proxy/{proxyId} |
| Endpoint pricing | Visual table | POST /api/proxy/{proxyId}/pricing |
| Test connectivity | (API-only today) | POST /api/proxy/{proxyId}/test |
| View totals | Overview tab numbers | GET /api/proxy/{proxyId}/analytics |
REST API routes use {proxyId} — the URL-safe slug (e.g., openweather-current-conditions-a1b2c3d4), not the dashboard's internal numeric database row ID. The dashboard and the REST API operate on the same underlying data model (same database tables, same validation rules), but the dashboard talks to the database through internal services rather than calling its own HTTP endpoints — so anything the dashboard can do is achievable programmatically through the REST API, just not via the exact same call sequence.
Next Steps
- Proxy Configuration - Full API reference for proxy management
- API Monetization - Strategies for monetizing APIs
- How It Works - Technical deep dive into L402